In an Indonesia buy-and-build Private Equity case, support each acquisition with evidence that the existing network can absorb it. Separate growth in branches already owned from revenue purchased, schedule savings from their actual start dates, and fund the transition before assuming cash benefits. The next deal should depend on service quality, collections and management capacity, as well as an attractive purchase multiple.
For candidates covering Indonesia from Jakarta, Singapore or elsewhere in Asia, geography must enter the operating model. Intertek's Indonesian testing and inspection network lists Jakarta, Surabaya, Medan and Balikpapan among its locations. A national footprint can span distinct service territories. Intertek, Indonesia testing and inspection.
Use that footprint to test which activities can be shared. Common purchasing contracts may cover multiple regions, while technician dispatch depends on local response times. Ask for dispatch records, travel costs, equipment needs and client qualification requirements before proposing branch closures or cross-region staffing.
Separate growth from the calendar effect of buying revenue
Suppose an Indonesian field-inspection business owns ten established branches, mainly in Java. It proposes acquiring six branches, including operations in Sumatra and Kalimantan, on 1 July of Year 1. All amounts below are IDR billion. Assume control begins at closing, no seasonality, no intercompany sales and no branch openings or closures. The standalone earnings below include existing central costs.
The existing branches generated revenue of 100 and EBITDA of 20 in Year 0. EBITDA means earnings before interest, taxes, depreciation and amortization. In Year 1, those same branches grow revenue by 5% at an unchanged 20% margin: revenue becomes 105 and EBITDA 21.
The acquired branches produce annual revenue of 40 and standalone EBITDA of 6, evenly through the year. Six months of ownership contribute revenue of 20 and EBITDA of 3. Consolidated Year 1 revenue is therefore 125, up 25%: five percentage points come from the existing branches and twenty from the acquisition. Calling the whole increase organic growth would conceal the dependence on deals.
A full twelve months of ownership would put revenue at 145 if both businesses then stayed flat. The difference between 125 and 145 is additional ownership time, not improved customer demand. Keep that effect visible in the next year's growth bridge.
Compare branches at the same stage of integration
The consolidated average also hides whether acquired branches improve. Track cohorts: groups acquired or migrated onto common processes at similar times. Compare their third month after migration with earlier cohorts' third month, allowing for location, customer mix and seasonality. Keep mature branches visible separately.
For this inspection business, request completed jobs, revenue per job, rework, customer retention and time from completed inspection to collected payment. Faster reported billing is weak evidence if customers dispute more invoices. Conversely, a young cohort's lower margin may reflect planned training rather than a failed acquisition. Trace the difference to actual costs before treating any expense as an earnings add-back.
This determines how much confidence to place in the savings calendar. Rentokil Initial's 2025 results describe a pause in North American integration and a simpler systems approach; they also separate savings achieved during the year from one-time costs to achieve savings. That historical experience illustrates why a service network's integration plan needs its own operating and cash schedule. Rentokil Initial, 2025 results, pages 7–8.
Put each saving on a start date
Return to the hypothetical Indonesian acquisition. Assume procurement savings of 1.2 a year begin on 1 October, while dispatch improvements worth 0.8 a year begin on 1 January of Year 2. Additional coordination staff cost 0.4 a year from the July closing and remain necessary. Savings and recurring costs accrue evenly once active.
| Integration item | Full annual effect | Year 1 effect |
|---|---|---|
| Procurement savings: October start | +1.2 | +0.3 |
| Dispatch savings: January Year 2 start | +0.8 | 0 |
| Recurring coordination staff: July start | −0.4 | −0.2 |
| Net recurring benefit | +1.6 | +0.1 |
The full annual benefit is a synergy run-rate: twelve months of the operating arrangement once all changes work. It is not the amount earned in the acquisition year.
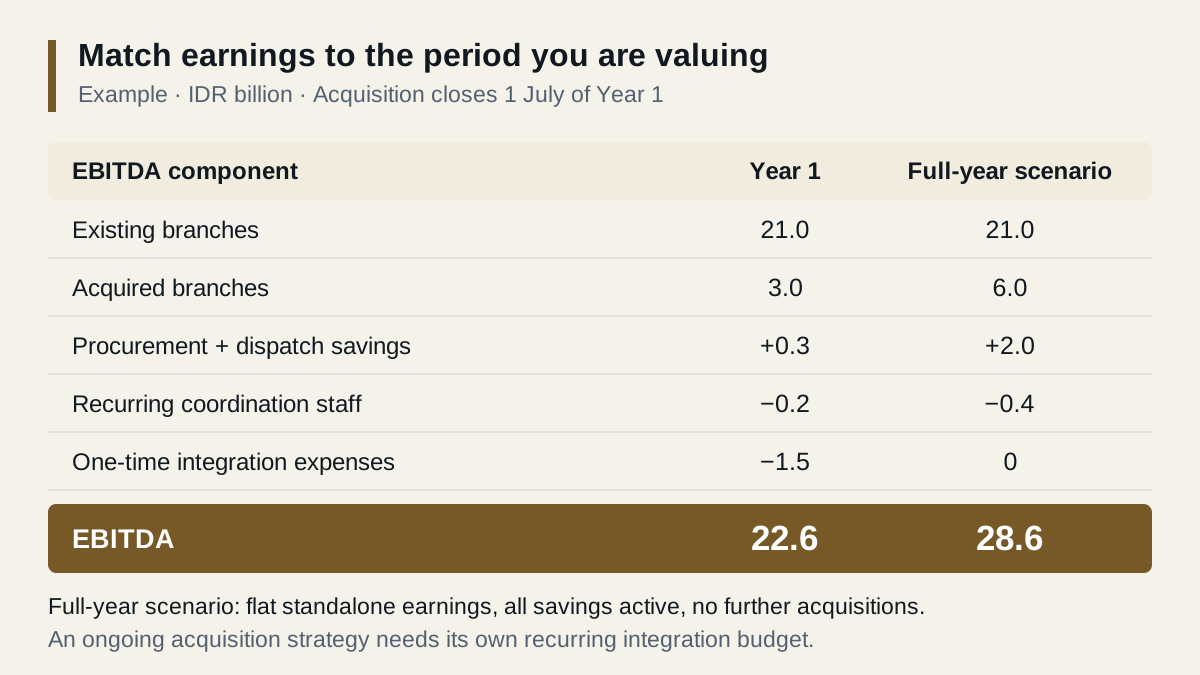
Assume another 1.5 of one-time integration expenses for this acquisition is incurred in Year 1. Year 1 EBITDA becomes 21 + 3 + 0.1 − 1.5 = 22.6. A full-year scenario with unchanged standalone earnings and all savings operating reaches 21 + 6 + 1.6 = 28.6. That scenario assumes no further deals or integration expenses. A continuing acquisition strategy needs an ongoing integration budget, even if each individual project happens once.
State which earnings figure supports your valuation. Confirm procurement savings against eligible spend and supplier terms, and test dispatch gains without worse response times or rework. Paying immediately for the full 1.6 of annual benefits assumes the buyer can deliver both initiatives on schedule.
Fund the transition separately
Now assume the 1.5 integration expenses are paid in Year 1, alongside 2.0 of capitalized equipment and software investment and 1.0 of additional operating working capital. The 0.1 net recurring benefit also converts to cash that year. Incremental transition cash outflow is 1.5 + 2.0 + 1.0 − 0.1 = 4.4, before tax and financing effects.
This is additional to acquisition consideration and ordinary business cash flows. Capital spending and working capital consume cash without being immediate EBITDA expenses. Adding back the 1.5 to discuss sustainable earnings does not eliminate its funding requirement. A monthly schedule must identify peak cash needs, because payments may precede savings; 4.4 is the net annual amount, not a committed liquidity limit.
Make acquisition pace an operating decision
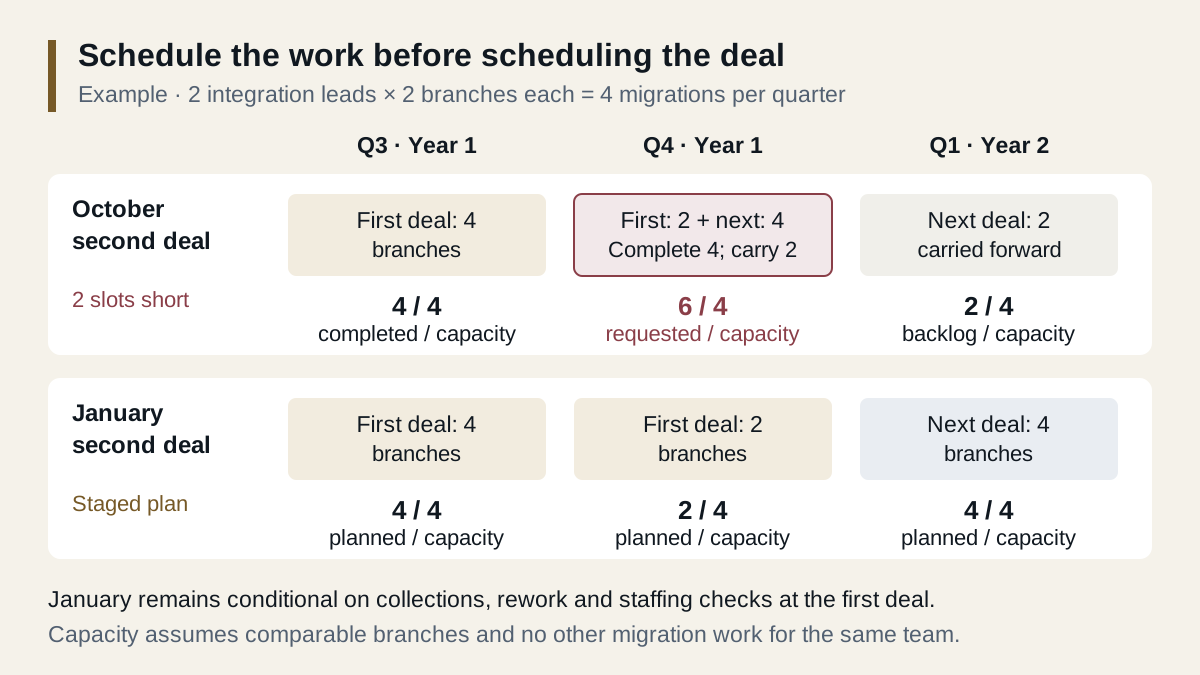
Suppose the existing integration team has two leads who can each migrate two branches per quarter, based on earlier migrations of comparable complexity, with no other migration work assigned. The six acquired branches need four slots in July–September and two in October–December. Another four-branch acquisition proposed for October would require six migrations that quarter against capacity of four. Completing the first deal's remaining two branches leaves room for only two from the second deal. Its other two branches enter Year 2 still waiting for integration, extending the period of parallel processes.
Hiring more staff may help, but only after training, travel and supervision are costed. A different option is to defer the second closing until January of Year 2. Before committing, require the first acquisition to complete two billing cycles with reconciled collections, stable rework rates and verified staffing coverage. Contract dates should accommodate those checks; January is an earliest scenario, not an unconditional deadline.
The investment recommendation can now be specific: proceed only at a price supported by standalone performance and conservatively timed improvements; reserve transition funding and condition the next acquisition on demonstrated capacity. Customer overlap alone does not establish that branch managers, systems or qualified inspectors are interchangeable.
Practise the follow-up that changes the recommendation
Explain the 25% revenue increase, the 22.6 acquisition-year EBITDA and the 4.4 transition outflow aloud. Then delay procurement savings from October to January while keeping all costs unchanged. Recalculate Year 1 earnings and funding, and explain whether you would still commit to the second acquisition. Continue with Private Equity Interview Prep.