Direct sales beats a distributor when the extra amount retained from sales exceeds the full cost of replacing the distributor's services for the same retailer demand. Test that proposition for an outlet cluster with a defined service promise. In an Indonesia case, a profitable urban route supports a targeted pilot; it does not justify converting every region to direct sales.
The tempting shortcut is to recover the distributor's entire discount as profit. A better answer explains which costs move to the manufacturer, which remain with the distributor, and how the result changes when deliveries become less productive.
Define the territory and the service being replaced
First clarify the model. Here, direct sales means the manufacturer invoices retailers; it can still hire a logistics provider. A distributor buys products and resells them. Its responsibility for retailer credit, stock and returns depends on the contract. Sales ownership and truck ownership are separate choices.
This distinction reflects services that businesses actually purchase. DKSH's service description separates sales and marketing from warehousing and transportation. Meanwhile, Unilever Food Solutions Indonesia described combining direct sales and key accounts with distributors and wholesalers in Unilever Indonesia's 2025 annual report. A mixed network is therefore a concrete option to evaluate.
Suppose a household-goods producer is considering direct coverage of 250 retailers in one Jakarta-area cluster. Compare that cluster separately from customers requiring replenishment through another island's warehouse. The World Bank's 2015 freight-logistics study examined inter-island supply chains, delivery uncertainty and inventory costs. Use those questions to investigate today's routes; the report's old cost figures are unsuitable as current assumptions.
The practical segmentation is by completed stops, order size, replenishment time and required stock availability. An island name alone cannot tell you whether a specific route is dense or economical.
Build a comparison from the manufacturer's perspective
Assume annual retailer invoices total IDR 12 billion before returns and tax under either channel, with identical product volume and mix. The distributor buys at a 10% discount to that value, so manufacturer invoices are IDR 10.8 billion. All figures below are hypothetical annual amounts in IDR million.
| Manufacturer's economic bridge | Direct sales | Distributor |
|---|---|---|
| Invoices before returns | 12,000 | 10,800 |
| Product cost | (7,200) | (7,200) |
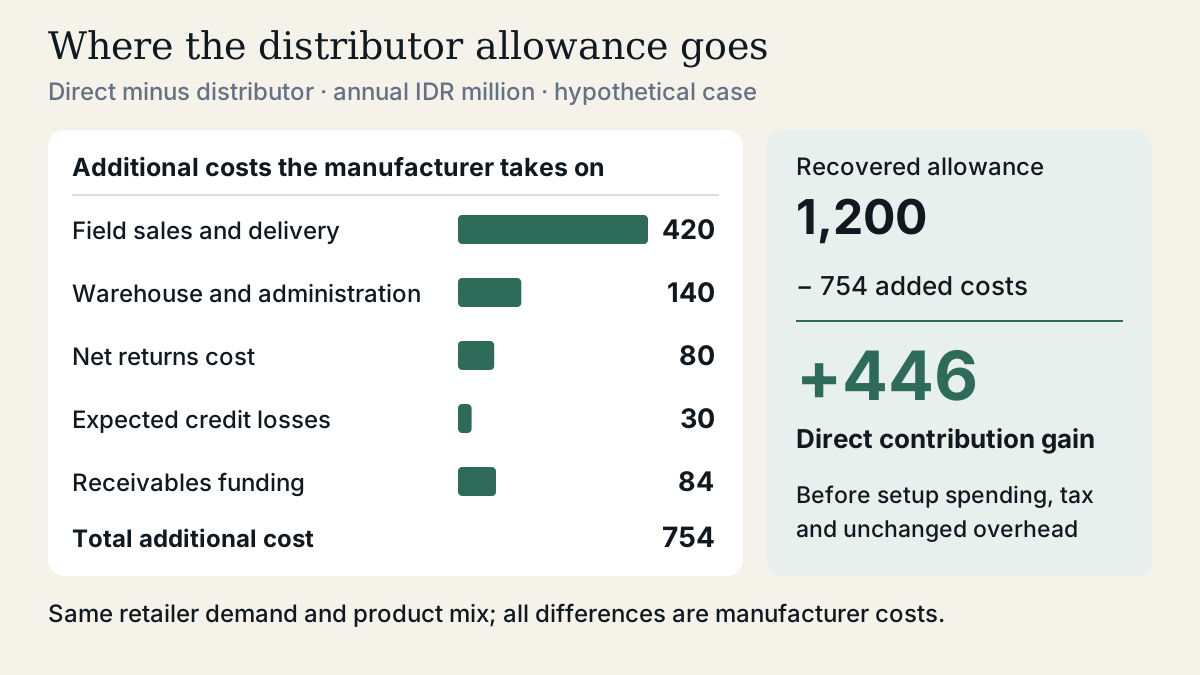
| Field sales and delivery | (540) | (120) |
| Warehouse, orders and administration | (180) | (40) |
| Net returns cost | (120) | (40) |
| Expected credit losses | (40) | (10) |
| Receivables funding cost | (120) | (36) |
| Contribution after listed costs | 3,800 | 3,354 |
The expenses in the distributor column are costs the manufacturer retains, including bulk delivery and account management. The distributor's own operating costs are funded from its discount; do not subtract them again from manufacturer contribution.
Direct sales gains IDR 1,200 million in invoices but adds IDR 754 million in costs, leaving IDR 446 million in annual incremental contribution. This is an economic comparison, before tax and unchanged corporate overhead. Assume equal producer-owned inventory and that operating costs include asset leases; initial setup spending requires a separate decision.
Turn route density and frequency into a cost
The IDR 540 million budget for direct selling and delivery assumes three combined sales and delivery visits per retailer each month: 250 × 3 × 12 = 9,000 completed stops annually. At IDR 60,000 per completed stop, the cost is IDR 540 million. If sales visits and deliveries require separate trips, model both.
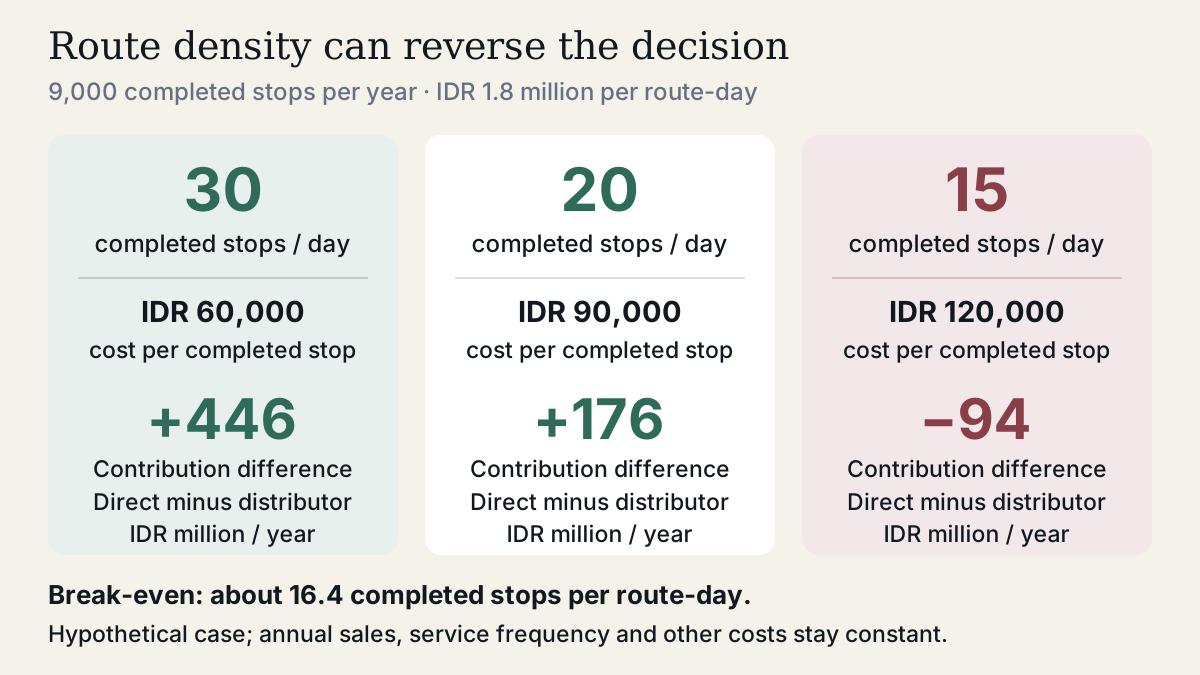
Suppose one team and vehicle operating a route for a day costs IDR 1.8 million, including staff and travel. Thirty completed stops make each stop cost IDR 60,000. Twenty stops raise it to IDR 90,000; fifteen raise it to IDR 120,000. Hold annual stops and sales constant, so lower daily productivity requires more route-days.
Count completed stops, not scheduled visits. A closed shop or rejected delivery still consumes travel and staff time. Check the assumed cost against the number of productive calls the team actually completes, including the effects of delivery windows, loading delays and collection tasks. A dense map is useful only if it produces a workable daily schedule.
At twenty stops, annual field-and-delivery cost becomes IDR 810 million, reducing the direct advantage to IDR 176 million. At fifteen stops, that cost becomes IDR 1,080 million and direct sales falls IDR 94 million behind the distributor. Break-even is about IDR 109,556 per completed stop, or 16.4 stops per route-day under these assumptions.
Service frequency can create the same problem. Increasing from three to four monthly visits, at unchanged sales and IDR 60,000 per stop, adds 3,000 stops and IDR 180 million annually. Ask what incremental sales or lower returns would justify that expense. Fewer visits might save money, but only if retailers can hold enough stock without increasing stockouts or expiry.
Check cash and returns before scaling
Even a productive route can absorb more cash if retailers pay slowly. The funding line uses a simplified 360-day year, uniform sales, gross invoices as the receivables base and a hypothetical 12% annual funding rate. Retailers pay the manufacturer after 30 days under direct sales; the distributor pays after 10 days.
Direct receivables are 12,000 × 30 ÷ 360 = IDR 1,000 million, costing IDR 120 million annually. Distributor receivables are 10,800 × 10 ÷ 360 = IDR 300 million, costing IDR 36 million. The additional IDR 700 million tied up in receivables is cash the business must fund, not an annual expense of IDR 700 million.
Expected credit losses are separate: some invoices may never be collected. A distributor does not automatically remove that risk; establish its payment obligation and any guarantees. Slower payment and default are different problems, even when both deteriorate together.
For returns, the table uses refunds less recoverable product value, plus extra handling, as one net economic deduction. Do not also deduct those refunds from its invoice starting point. In published accounts, presentation differs: Unilever Indonesia's revenue policy reports revenue net of returns, rebates and discounts. Ask who bears expired stock, retailer refusals and promotional over-ordering under each contract.
Direct coverage can also require more stock, challenging the table's equal-inventory assumption. If it requires an additional 30 days of manufacturer-owned stock at the stated product cost, it ties up another 7,200 × 30 ÷ 360 = IDR 600 million. At unchanged supplier payment terms and the same 12% funding rate, that adds IDR 72 million annually, reducing the base advantage to IDR 374 million. The decision can remain attractive while needing substantially more cash to operate.
Recommend a pilot with conditions that can fail
A useful recommendation is: “Pilot direct sales in this cluster, where the base case adds IDR 446 million annually. Retain distributor coverage elsewhere until route data supports a change. Expansion depends on completed-stop productivity, collection performance and returns, with setup spending and additional inventory funded separately.”
Prepare three follow-ups: Would the distributor reprice the remaining territory after losing its strongest routes? Can we retain the same retailer sales during a channel transition? Does direct control improve stock availability enough to cover a more frequent service promise? Each can change the comparison beyond the initial spreadsheet.
For your next practice, start from the original base case, increase direct payment time to 45 days and recalculate the advantage before giving a 60-second recommendation. Then use Elite Interview Guide's MBB Case Interview Prep page to continue practising case decisions. Mock Interview sessions and feedback are system-generated and English-only.