In a Korean exporter case, explain rising revenue and falling profit by holding the exchange rate constant first. Separate units sold, the price customers pay in their invoice currency, imported input costs and domestic expenses. Then restore the currency effect on both sales and purchases. This reveals whether a weaker won improved the business or merely softened an operating decline.
That distinction matters when preparing for consulting interviews about Northeast Asian manufacturers. In its preliminary Q4 2025 results, Hyundai reported revenue growth of 0.5% and an operating-profit decline of 39.9%. It cited favorable exchange rates and higher-value models as revenue support, alongside tariffs and incentives that pressured profit. Several forces can operate simultaneously. Hyundai Motor’s Q4 2025 release.
Start with the invoice currency and the rate convention
Ask what “revenue increased” measures: won, dollars or physical units. The Bank of Korea compiles export and import price indexes in Korean won, contract currencies and US dollars, and advises users to check the currency basis. Its distinction is useful here: a change in the won value of an invoice need not be a change in the price the customer paid. Bank of Korea, Appendix 1, pages 7–8.
Suppose a Korean component manufacturer sells to customers in Taiwan, China and Southeast Asia. All sales and imported materials are invoiced in US dollars; domestic labor and other local costs are in won. Customer location alone does not determine invoice currency, so make that assumption explicit.
Compare two full years. Assume one unchanged product, no inventory timing differences, and recognition of sales and inputs at the stated annual rate. Exclude hedges, interest and tax. Fixed operating costs include all remaining operating expenses, including depreciation.
| Driver | Previous year | Current year |
|---|---|---|
| Units sold | 100,000 | 110,000 |
| Selling price, USD per unit | 100 | 95 |
| Imported materials, USD per unit | 40 | 50 |
| Domestic variable cost, KRW per unit | 35,000 | 35,000 |
| Fixed operating costs, KRW million | 2,000 | 2,400 |
| Exchange rate, KRW per USD | 1,300 | 1,430 |
The rate rises 10%: one dollar buys more won, so the won weakens. Use “KRW per USD” throughout. Reversing the quotation silently reverses the commercial conclusion.
Build revenue at last year’s exchange rate
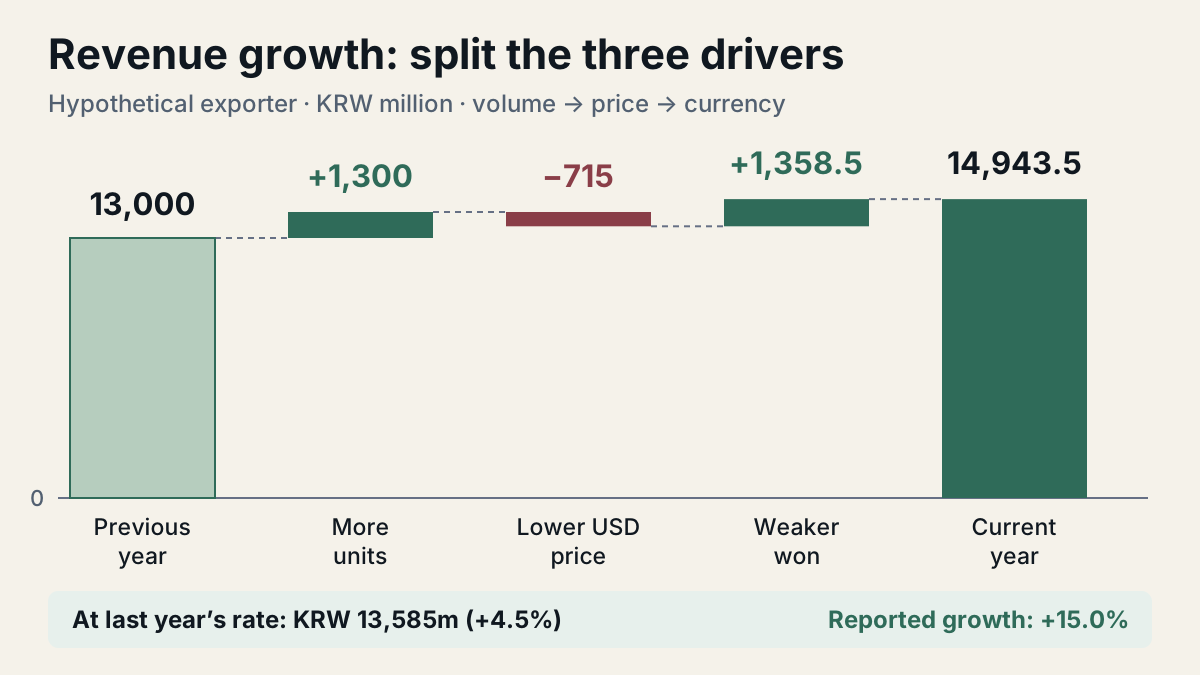
Revenue equals units × dollar price × won per dollar. Last year, that was 100,000 × USD 100 × 1,300 = KRW 13,000 million. This year, reported revenue is 110,000 × USD 95 × 1,430 = KRW 14,943.5 million, up approximately 15.0%.
Constant-currency revenue means calculating current activity at the old rate: 110,000 × USD 95 × 1,300 = KRW 13,585 million, up only 4.5%. Actual volume grew 10%, but the 5% dollar price reduction absorbed part of that benefit.
To reconcile every won, change volume first, then price, then the exchange rate:
- Volume adds 10,000 × USD 100 × 1,300 = KRW 1,300 million.
- Price removes 110,000 × USD 5 × 1,300 = KRW 715 million.
- Currency adds 110,000 × USD 95 × 130 = KRW 1,358.5 million.
These add to the reported increase of KRW 1,943.5 million. The sequence allocates interactions between drivers; another stated sequence can allocate them differently while reaching the same total. Do not add percentage changes as if they were independent amounts.
Carry imported inputs into the profit calculation
Revenue does not show how much the business retains. Calculate operating profit as revenue minus imported materials, domestic variable costs and fixed operating costs.
| KRW million | Previous year | Current year at old rate | Current year reported |
|---|---|---|---|
| Revenue | 13,000 | 13,585 | 14,943.5 |
| Imported materials | 5,200 | 7,150 | 7,865 |
| Domestic variable costs | 3,500 | 3,850 | 3,850 |
| Fixed operating costs | 2,000 | 2,400 | 2,400 |
| Operating profit | 2,300 | 185 | 828.5 |
Reported operating profit falls approximately 64.0%, and operating margin falls from 17.7% to 5.5%. At constant currency, almost all the original profit disappears.
For a complete profit bridge, increase volume first at last year’s unit economics. Each additional unit contributes (USD 100 − USD 40) × 1,300 − KRW 35,000 = KRW 43,000 before fixed costs. The extra 10,000 units therefore add KRW 430 million.
Next, the lower selling price removes KRW 715 million. The USD 10 rise in imported materials removes 110,000 × USD 10 × 1,300 = KRW 1,430 million. Higher fixed costs remove another KRW 400 million. Profit is now KRW 185 million, before restoring the exchange-rate change.
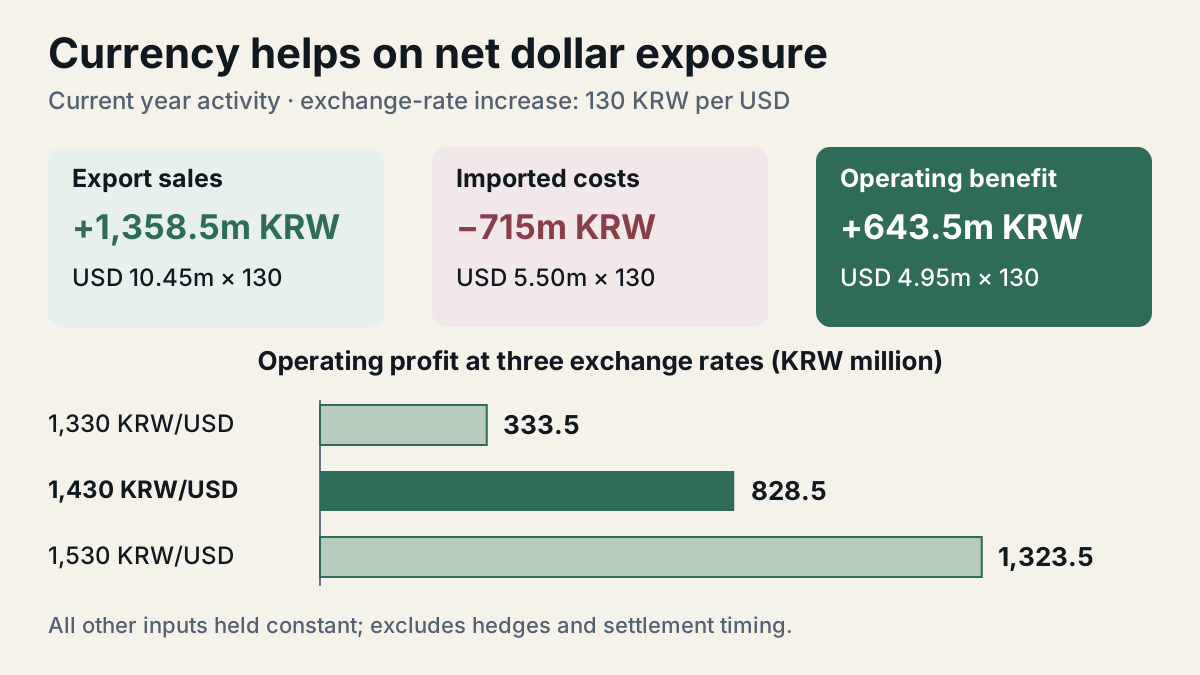
Currency adds KRW 1,358.5 million to revenue but also KRW 715 million to imported costs. Its net benefit to operating profit is KRW 643.5 million, bringing profit to KRW 828.5 million. In this example, the weaker won helped; the underlying price and cost movements overwhelmed that help.
Recommend a test that could change the decision
Start with the largest operating loss: the imported-material increase. Request supplier invoices, purchase quantities and material consumption per finished unit for the relevant product. This distinguishes a higher supplier price from greater material usage, poorer yield or a changed component specification. Each explanation requires a different response.
If supplier prices explain the increase, compare renegotiation and qualified alternatives, including freight, quality and switching costs. If usage explains it, examine scrap and production yield before changing suppliers. In parallel, check whether the USD 5 sales discount was required to retain existing customers or win incremental orders; volume growth alone cannot establish its value.
A USD 1 reduction in material cost would recover KRW 157.3 million annually at current volume and exchange rates, provided output and quality remain unchanged. That gives the next test an economic scale. It is still necessary to compare the saving with implementation costs and customer constraints. Before closing, test how currency, existing hedges and extra volume could change the recommendation.
Prepare for the follow-up
What if the won strengthens? Current dollar sales less imported materials equal 110,000 × (USD 95 − USD 50) = USD 4.95 million. A fall of KRW 100 per USD reduces modeled profit by KRW 495 million, leaving KRW 333.5 million, with everything else unchanged.
Is that exposure already hedged? Ask about contracts, settlement dates and existing hedges before recommending a treasury action. Dollar input purchases provide a partial natural offset, but their timing may differ from customer collections.
Does more volume solve the problem? Current contribution before fixed costs is (USD 95 − USD 50) × 1,430 − KRW 35,000 = KRW 29,350 per unit. Additional units help only if their contribution remains positive and they do not require disproportionate extra capacity or discounts.
For your next practice session, rebuild both bridges without looking at the tables, then give a 60-second recommendation naming the largest loss, the currency benefit and the first evidence request. Continue with MBB Case Interview Prep at Elite Interview Guide. Online Mock Interview sessions and feedback are system-generated and English-only.