
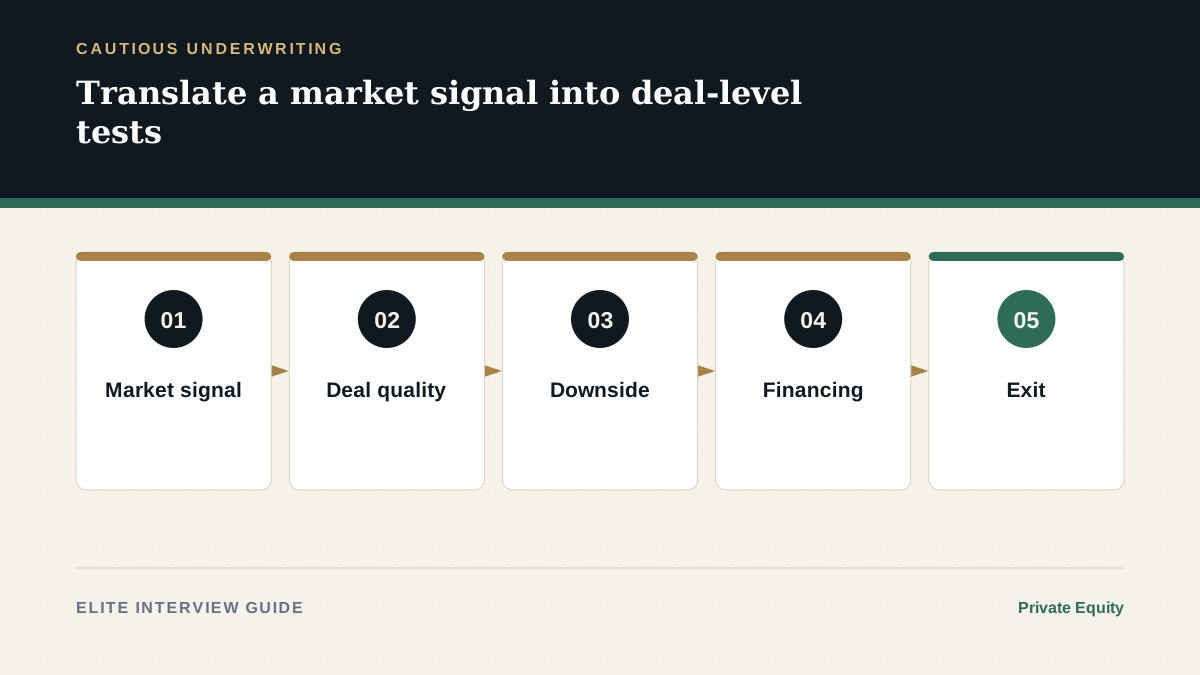
If your investment case begins with “Southeast Asia is growing,” a cautious deal market should make you uncomfortable. Slower activity does not remove the need to invest; it raises the standard for price, downside protection, financing and the evidence behind every growth assumption.
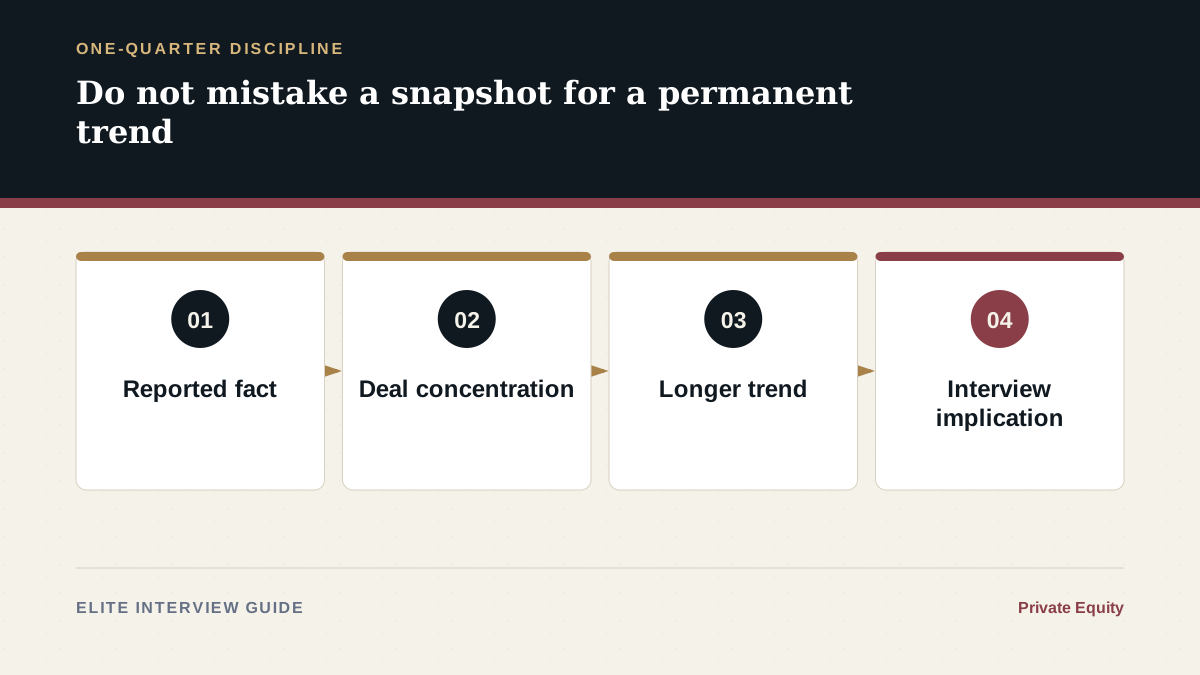
The latest quarter gives you useful interview material—but only if you resist two shortcuts. First, do not turn one quarter into a permanent trend. Second, do not recite deal statistics without explaining what they change in underwriting.
The core quarterly source covers April–June 2026. Deal databases differ in scope, disclosure and classification, so each figure below stays attached to the named report.
What Q2 2026 actually says
EY-Parthenon’s Southeast Asia Private Equity Pulse for Q2 2026 reported:
| Measure | Q2 2026 snapshot reported by EY | Interview implication—not a fact from the report |
|---|---|---|
| PE-backed investments | 10 deals; US$935.5m deployed | Ask whether fewer large deals reflect price, financing, uncertainty or simply timing |
| Comparison with Q1 | 19 deals; US$9.2b in Q1 | Quarter-to-quarter value is highly sensitive to megadeals |
| Year-on-year | Volume down 55%; value down 58% | A candidate should test whether caution is broad or sector-specific |
| Deal mix | One investment above US$500m; no megadeal above US$1b | Mid-market underwriting and execution may matter more than headline value |
| Concentration | One US$850m real-estate transaction drove most disclosed value | Never read an aggregate without checking concentration |
| Exits | 11 exits; US$4.2b of realised proceeds | Deployment slowed while liquidity improved; the signals are not one-directional |
| Fundraising | One fund close in the quarter | Capital formation and deal activity are related but not identical |
EY also described Southeast Asian private debt as early-stage and fragmented across regulatory regimes, legal systems and capital-market development. It reported one private-debt fund close of US$320m in the quarter. That is evidence of activity, not proof that private debt is the right answer for every company.
What one quarter cannot prove
Q2 cannot tell you, on its own, that the region has become unattractive, that entry multiples have fallen across sectors, that debt is unavailable, or that every sponsor is waiting. The quarter was heavily affected by the absence of megadeals and the concentration of disclosed value in one real-estate transaction.
Cross-checking a longer period changes the frame. Deloitte’s 2026 Southeast Asia PE Almanac reported 56 buyout deals with US$6.4b of disclosed value in 2025, versus 74 deals and US$9.4b in 2024. It described a more selective market, with mid-market deals accounting for 64% of buyout volume, and highlighted elevated dry powder alongside constrained exits.
Bain’s Global Private Equity Report 2026 gives a wider lens: the 2025 recovery in global deal and exit value was narrow and megadeal-driven, while distributions and fundraising remained difficult for many managers. Global context does not replace Southeast Asian data, but it helps you avoid explaining every local observation with a local cause.
The right interview sentence is: The latest quarter is a caution signal whose composition matters, not a verdict on the region.
How a slower market changes the questions
Entry price
“Good company” becomes less useful when price discovery is difficult. Ask:
- What growth and margin path is already embedded in the entry valuation?
- Which comparable transactions are truly comparable in country, sector, size and timing?
- Is the seller anchored to an older market, and can structure bridge the valuation gap?
- Does the deal still work without multiple expansion?
Do not assume slower volume automatically means cheaper assets. High-quality platforms can remain contested even when aggregate activity falls.
Leverage and cash conversion
A model can show debt paydown while hiding the operating mechanism. Pressure-test:
- EBITDA-to-cash conversion, including working capital and maintenance capex.
- Currency mismatch between debt and operating cash flows.
- Interest coverage under higher base rates or weaker earnings.
- Covenant headroom and refinancing timing.
- Whether downside liquidity arrives before management can fix operations.
Hold period and exit
If exits take longer, the sponsor may need another year of operational value creation rather than another turn of multiple expansion. Ask which buyer universe remains credible: strategic, sponsor-to-sponsor, public market or recapitalisation. A base case that names only “exit at 10x” is not an exit plan.
Evidence behind growth
The Asian Development Bank’s July 2026 outlook showed divergent growth and inflation forecasts across Southeast Asian economies. That makes a single regional demand assumption especially weak. Break the forecast by country, customer segment, price, volume and channel; identify which evidence belongs to the company and which is macro context.
Equity and private debt are different underwriting conversations
| Question | Control / growth equity lens | Private-debt lens |
|---|---|---|
| Primary return source | Earnings growth, margin improvement, cash generation and exit value | Contractual yield, fees, principal protection and recovery |
| Governance | Control rights, board influence, management and execution | Covenants, information rights, security, intercreditor position |
| Downside | Equity impairment and ability to change the plan | Default probability, loss severity, collateral and restructuring path |
| Upside | Operational value creation and strategic options | Often capped unless warrants or other participation exist |
| Core question | Can we own and improve this business at this price? | Can this borrower service and repay us, and what protects us if it cannot? |
In an interview, do not say private debt is “safer.” Explain the seniority, covenants, cash flow, security and recovery path that may make a specific instrument more defensive—and the risks that remain.
Rebuild the growth thesis in three cases
Assume a hypothetical regional healthcare-services platform. Its management case expects new clinics, higher utilisation and procurement savings.
| Case | Operating assumptions | Financing / exit consequences | Evidence required |
|---|---|---|---|
| Base | Openings on schedule; utilisation ramps gradually; procurement savings partly realised | Moderate leverage; exit to strategic or sponsor after operating proof | Site pipeline, clinician hiring, cohort ramp, payer mix |
| Downside | Permits and hiring delay openings; mature-site demand holds; savings arrive late | Lower debt capacity; liquidity buffer needed; exit delayed | Break-even by cohort, fixed-cost exposure, covenant headroom |
| Upside | Existing sites fill faster; cross-referrals improve mix; integrations repeat | Faster deleveraging; add-on capacity may increase | Referral conversion, capacity constraint, integration track record |
Notice what is missing: “the healthcare market is growing.” The market supports the question. The investment case depends on site-level economics, execution and price.
A 90-second market answer
Here is a synthetic answer structure:
That answer does four jobs: states the data, explains its limitation, changes the underwriting and names the evidence that would update the view.
Questions to ask yourself before the interview
- Does the cited report cover announced deals, completed deals, buyouts only or all PE-backed investments?
- Is disclosed value concentrated in one transaction?
- What changed in entry price, financing or diligence—or am I merely assuming it changed?
- Which country and sector drive my company’s cash flow?
- What happens if the hold period extends by two years?
- Which risk can be mitigated, and which is simply not underwritable?
- What new quarterly data would make me revise the thesis?
Sources
- EY-Parthenon Southeast Asia PE Pulse Q2 2026 — quarterly investments, exits, fundraising and private-debt context.
- Deloitte Asia Pacific Private Equity 2026 Almanac: Southeast Asia — 2025 buyout, exit, sector and dry-powder context.
- Bain Global Private Equity Report 2026 — wider market context.
- ADB Asian Development Outlook, July 2026 — current macro variation across Southeast Asia.