In a Southeast Asia operations interview, establish what each market's numbers count before recommending where to intervene. Match order eligibility, delivery promises and observation periods, then separate service mix from performance within each service. Keep the actual customer outcome visible alongside the adjusted comparison. A lower market average can reflect a harder mix while still identifying a large operational problem worth solving.
Start with the decision and the operating footprint
Suppose you interview for a Singapore-based regional operations role at an online retailer. The exercise covers Singapore, Jakarta and Ho Chi Minh City. Management sees on-time delivery of 87% for Singapore and 68% for Jakarta, and asks where to send a small improvement team. These figures describe the company's selected city operations, not national logistics performance.
Ask for order-level records and the promise shown at checkout. An order created, paid, accepted for fulfilment and delivered can appear in different reports at different times. Shopify's sales-report documentation, for example, includes pending, canceled and unpaid orders in gross sales. Its label therefore cannot establish how many paid orders were ready to fulfil. Map the actual fields before comparing the exports.
Agree on which orders enter the calculation
For this exercise, use unique prepaid orders accepted for fulfilment during the same Monday-to-Sunday local calendar week. This weekly group is an order cohort. Exclude tests and duplicates. Keep orders canceled after acceptance in the denominator as failures to deliver, with cancellation reasons reported separately. Otherwise a team could improve its rate by canceling difficult orders.
Assume both operations promise delivery within 48 elapsed hours for standard service and eight elapsed hours for same-day service; same-day acceptance closes at 14:00 local time. The clock starts at acceptance and never pauses for weekends. Count only complete orders delivered by their original deadline as on time. Do not reset that deadline after a delay.
Store the local promise and its UTC timestamp so headquarters can reconcile events across cities. Close each weekly cohort seven days after its local Sunday ends. Assume delivery scans arrive within 24 hours; this gives even the latest standard orders time to reach their deadline and be recorded. An immature current-week cohort would unfairly penalize orders still within their promise.
Recalculate the ranking at a common service mix
Assume each operation has 1,000 eligible orders under those rules:
- Singapore: 900 standard orders at 90% on time, plus 100 same-day orders at 60%. That is 810 + 60 = 870 on-time orders, or 87%.
- Jakarta: 100 standard orders at 95% on time, plus 900 same-day orders at 65%. That is 95 + 585 = 680 on-time orders, or 68%.
Jakarta has the higher rate within both services. Its aggregate is lower because same-day orders, which have lower on-time rates in both operations, make up much more of its business. To compare at a common mix, use the combined sample's 1,000 standard and 1,000 same-day orders: equal 50% weights for both operations. Singapore becomes 0.5 × 90% + 0.5 × 60% = 75%; Jakarta becomes 0.5 × 95% + 0.5 × 65% = 80%.
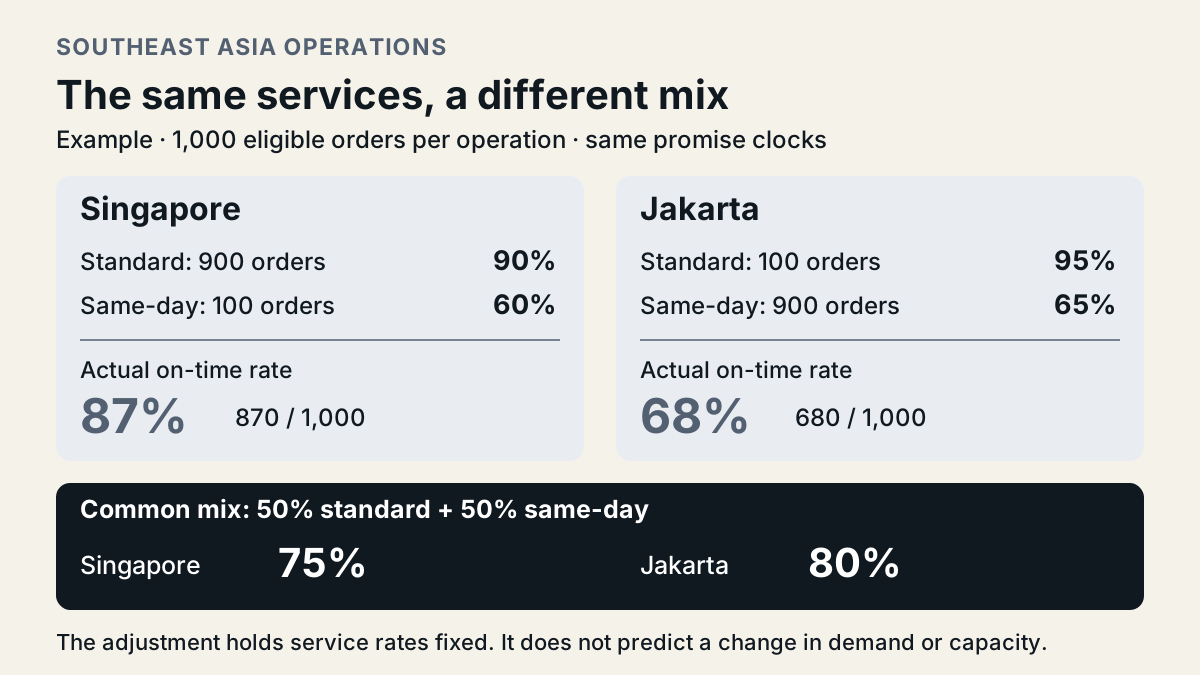
This adjustment holds the observed service rates fixed while changing their weights. It does not predict what would happen if the retailer moved hundreds of orders between services. Capacity, route density and customer behavior could change. Nor does the five-percentage-point adjusted gap prove one local team is better: distance, seller readiness and order complexity remain possible differences within each class.
The actual 68% still matters. Jakarta has 320 failures, including 315 same-day failures; Singapore has 130, including 40 same-day failures. A comparison that explains the ranking has not removed those customer problems.
Put refunds back with the orders that caused them
Delivery is only one outcome. Suppose management also wants a refund-rate comparison. Shopify's reporting rules put sales on their sale dates and reversals on their processing dates, while distinguishing sales reports from cash movements. That reporting view can be useful, but dividing this week's processed refunds by this week's new orders mixes different groups.
Consider Singapore's 1,000 accepted orders from week A. Assume 30 distinct orders each receive one refund within 28 days of acceptance: ten during week A and twenty during week B. Another fifteen orders accepted before week A are refunded during week A. Operations processed 25 refunds in week A, but the week-A order cohort's 28-day refund rate is 30 / 1,000 = 3%. The tempting 25 / 1,000 = 2.5% joins an unmatched numerator and denominator.
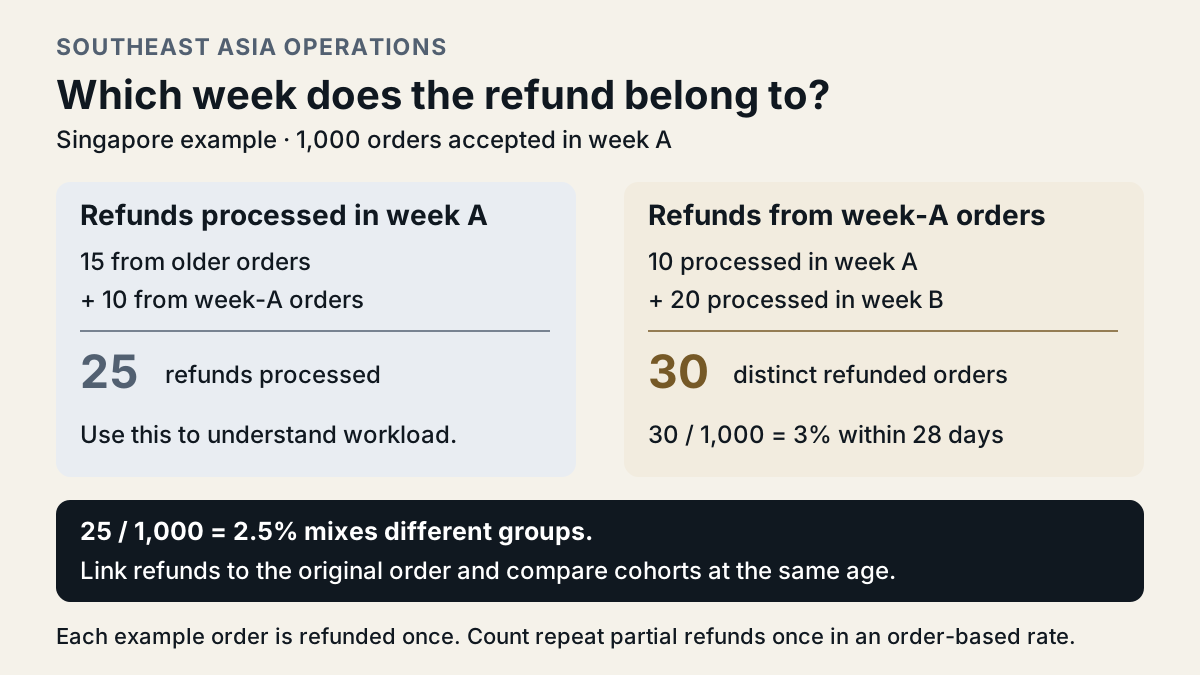
Google Analytics' ecommerce guidance links refund events to the original transaction identifier and recommends item details for item-level reporting. Apply that linking discipline to the retailer's records, then reconcile against payment and fulfilment systems. An analytics event alone does not establish complete coverage. For the order-based rate, count an order once even if it has several partial refunds; report refunded value separately and compare cohorts at the same 28-day age.
Choose an intervention that the evidence supports
Recommend diagnosing Jakarta's same-day operation first because it contains 315 orders not delivered on time in the exercise. Separate cancellations by reason, then inspect acceptance-to-pickup and pickup-to-delivery times by dispatch window and route. Suppose late pickup is concentrated in one window: test a capacity change there, with an owner, cost limit and the same order rules. Keep cancellations, delivery cost and refunds visible so a faster headline rate cannot conceal a worse outcome elsewhere. If delays occur after pickup, a warehouse staffing change may miss the problem.
Use Singapore's five-point gaps within each service to investigate specific process differences, without copying Jakarta's practices before matching route and order conditions. Additional staff should follow an identifiable bottleneck and a feasible improvement, rather than the lowest aggregate alone.
Give Ho Chi Minh City a different first action. Assume its export counts placed orders and includes cash-on-delivery orders, while the two reviewed cohorts are prepaid. Map acceptance, payment method, cancellation and promise fields before adding it to the comparison. Report comparable prepaid segments and a separate cash-on-delivery view. Excluding that second segment from the regional customer picture would hide part of the operation.
For spending decisions, compare contribution on consistent terms: retained merchandise revenue less product, payment, delivery and refund-handling costs, with taxes and corporate overhead excluded for this exercise. Reconcile returned inventory treatment with finance. Keep local-currency results and convert regional totals using one stated exchange-rate convention; never add Singapore dollars directly to rupiah. A percentage-point improvement does not tell you whether the intervention pays for itself.
Practise a two-minute recommendation: explain the 87% versus 68% ranking, reproduce the common-mix comparison and choose the first diagnostic. Then change the common same-day weight to 80% and recalculate both rates. Identify the additional evidence needed before assigning budget. Explore Elite Interview Guide's interview preparation services for your next preparation step.