In a Taiwan manufacturing case interview, compare each operation in the same unit: saleable products per shift. Adjust for defects and downstream capacity, then test one improvement at a time. The best intervention is the one that increases output customers can accept under the required product mix, at a justified cost. A faster upstream machine may add only inventory.
Why product variety belongs in the calculation
Taiwan's Industrial Technology Research Institute described technologies addressing low-volume, high-mix production at TAIROS 2019. High mix means producing several product variants, potentially with different processing requirements. Delta's electronics-assembly solution page likewise identifies frequent changeovers as a production consideration.
These sources give a reason to ask about product variety; they do not establish one standard Taiwanese factory. For a candidate with engineering or supplier experience, the useful interview move is to connect the actual order mix to machine time. A line's quoted capacity for its simplest model may overstate what it can deliver against customer orders.
Define the output before diagnosing the line
Suppose a Taiwanese supplier assembles industrial control modules for equipment customers in Taiwan and Southeast Asia. Its minimum shipment target is 900 acceptable modules per shift, and its order backlog can absorb additional output. Initially, every order is for the standard model. Materials, staffing and customer acceptance requirements are fixed, and packaging has ample capacity.
Assume a steady production flow, no inventory drawdown, no rework and no additional losses between stations. Each station has 420 operating minutes per shift after breaks, changeovers and downtime. The capacities below already reflect that available time. Yield means the proportion of units entering a station that pass and move forward.
| Operation | Maximum units entering per shift | Yield | What happens next |
|---|---|---|---|
| Board assembly | 1,200 | 98% | Passed boards enter sealing |
| Sealing | 1,000 | 90% | Passed modules enter functional test |
| Functional test | 1,050 | 95% | Passed modules can ship |
Capacity is a station's processing ceiling. Throughput is the rate at which products actually leave the system. A bottleneck is the constraint that limits that throughput under the current conditions. Keep all three separate: a machine processing more units does not necessarily increase shipments.
Follow the units through the constraint
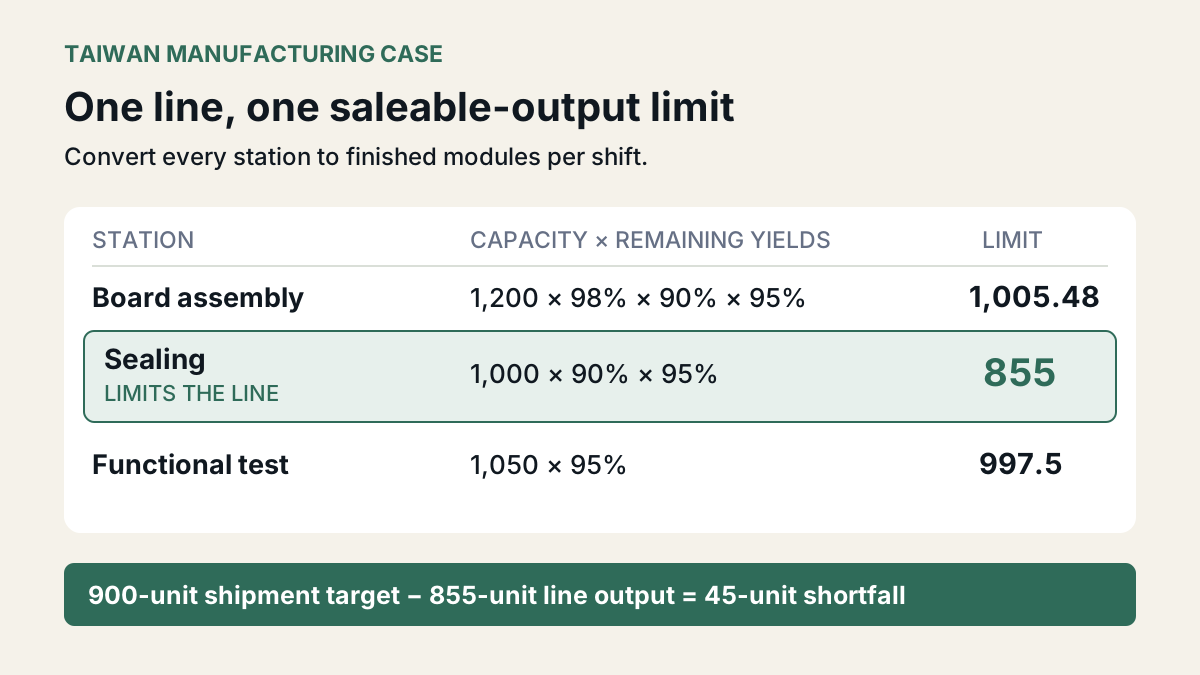
Assembly could supply 1,200 × 98% = 1,176 acceptable boards. Sealing can accept only 1,000, so its output is 1,000 × 90% = 900 modules. Testing can handle those 900 and passes 95%, leaving 855 saleable modules per shift. The shipment shortfall is 45.
Do not multiply every station's capacity together or average their yields. A useful cross-check is to express each station's independent limit in finished-unit equivalents:
- Assembly: 1,200 × 98% × 90% × 95% = 1,005.48.
- Sealing: 1,000 × 90% × 95% = 855.
- Testing: 1,050 × 95% = 997.5.
The smallest limit is 855. Decimal outputs are planning averages over repeated shifts; an actual shipment contains whole modules. Sealing limits the line, even though testing has its own defects.
Running assembly at full speed would create 176 more acceptable boards than sealing could process each shift. Those boards would accumulate as work in progress. Toyota's description of its production system connects synchronized production with making what the next process needs and preventing defects. In this exercise, that principle suggests controlling releases to sealing while investigating its losses.
Compare fixes using incremental shipments
Assume each proposed change leaves every other input unchanged. Recalculate the entire line after each change, because the bottleneck can move.
| Proposed change | Saleable modules per shift | Increase |
|---|---|---|
| Raise assembly capacity by 20% | 855 | 0 |
| Raise sealing yield from 90% to 98% | 931 | 76 |
| Raise testing yield from 95% to 99% | 891 | 36 |
| Raise sealing input capacity by 10% | 940.5 | 85.5 |
The sealing-yield proposal produces 1,000 × 98% × 95% = 931. The testing-yield proposal produces 1,000 × 90% × 99% = 891. Both quality improvements help; only the sealing improvement reaches the 900-unit target. Extra assembly capacity adds no shipments.
That does not make quality improvement automatically cheaper than equipment. The case has not supplied implementation costs, achievable yields or qualification time. Recommend a sealing defect investigation and a controlled improvement trial, then compare its cost and timing with the sealing-capacity alternative. Test the assumed 98% yield across relevant products and shifts while holding acceptance criteria constant. Relaxing the specification is not a yield improvement.
Change the mix and find the new bottleneck
Before committing to either sealing proposal, check the coming order mix. Suppose half the orders switch to a reinforced model. Its assembly and sealing requirements are unchanged, but it needs 0.6 minutes of functional testing, versus 0.4 minutes for the standard model. Both retain a 95% testing yield. The required 50:50 unit mix is fixed, and the 420 minutes still exclude changeovers.
The average test time is 50% × 0.4 + 50% × 0.6 = 0.5 minutes per module. Testing capacity becomes 420 ÷ 0.5 = 840 modules, yielding 798 saleable modules. Weight processing times before dividing available time; averaging the two models' production rates gives the wrong answer.
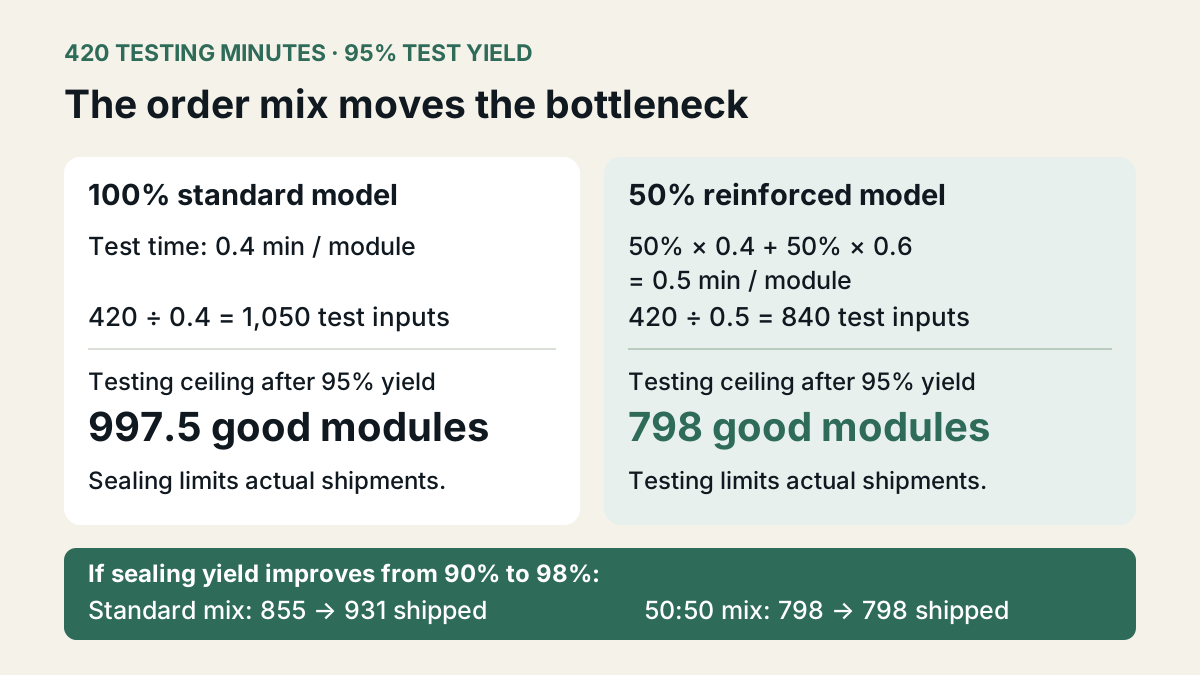
Sealing already supplies 900 modules at its original yield, more than testing can accept. Raising sealing yield now saves defective material but adds no shipments unless testing capacity also improves. Keep those benefits separate.
After the sealing-yield improvement, shipping 900 good modules at the new mix requires 900 ÷ 95% × 0.5 = approximately 474 testing minutes, about 54 beyond the current allowance. This is a planning requirement, not proof that overtime, parallel fixtures or a shorter test procedure is feasible. Each option needs engineering and quality validation.
Give a recommendation that survives the follow-up
An answer could begin:
Be ready for three follow-ups: Are failed units scrapped or retested on the same machine? Does the operating-time allowance include changeovers for the proposed schedule? Must each customer receive a fixed mix, or can orders move between shifts? These answers change the model. Also distinguish an average capacity above demand from reliable on-time delivery when downtime and defects vary.
Rebuild the two scenarios on one page without looking at the tables. State the limiting station, incremental shipments and one validation question for each proposal, then record a 60-second recommendation. Use the MBB Case Interview Prep guide to connect this calculation to a complete case answer.