In a Taiwan supplier banking interview, explain rising profit and negative operating cash flow by reconciling the same period's earnings, non-cash expenses and working-capital movements. Then test whether receivables and inventory are growing because of more business, temporary shipment timing or weaker collection. The cash conversion cycle helps identify the cause; a dated cash forecast determines how much funding is needed.
For candidates discussing Taiwan businesses with teams in Taipei, Hong Kong or Singapore, the useful regional detail is the operating arrangement: where goods are stocked, which customer entity owes payment, and what starts its payment clock. A buyer's country alone does not answer those questions.
Establish the period before calculating the bridge
Profit measures activity over a period. A balance sheet records balances on a date. To explain a quarter's cash flow, compare the balances at that quarter's beginning and end; do not subtract last September's receivables from this September's and call the result a quarterly movement.
The IFRS Foundation's IAS 7 overview describes the indirect method as adjusting profit for non-cash transactions and accruals, while separating operating, investing and financing activities. In a company filing, follow its actual starting subtotal and classifications. A simplified net-profit bridge works only when its assumptions explain the omitted adjustments.
Reconcile a Taiwan component supplier's quarter
Suppose a Taiwan-based distributor buys finished electronic modules and supplies assembly customers in China and Vietnam. It holds additional stock in Taiwan before a customer launch. Some customers pay after delivery acceptance, so shipping goods does not immediately produce cash.
Use a 90-day planning quarter, with every amount in NT$ million. Revenue is 900 and net profit is 54, versus 720 and 36 in the comparable prior-year period: revenue rises 25% and profit 50%. Current cost of goods sold is 720, entirely the purchase cost of modules sold. Depreciation of 18 is included in operating expenses. All sales and inventory purchases are on credit.
Assume cash taxes equal the tax expense included in net profit; other operating expenses are paid as incurred. There is no interest, foreign-exchange movement, acquisition, inventory write-down, receivables impairment or other working-capital change. These assumptions let balance movements represent cash-timing differences.
| Operating balance | Quarter opening | Quarter closing | Increase | Effect on operating cash |
|---|---|---|---|---|
| Trade receivables | 120 | 210 | 90 | −90 |
| Inventory | 180 | 270 | 90 | −90 |
| Trade payables | 144 | 180 | 36 | +36 |
The bridge is 54 + 18 − 90 − 90 + 36 = −72. Customers owe more, and more purchased goods remain unsold. Suppliers fund part of that expansion through higher unpaid invoices, but their 36 contribution does not cover the 180 absorbed by receivables and inventory.
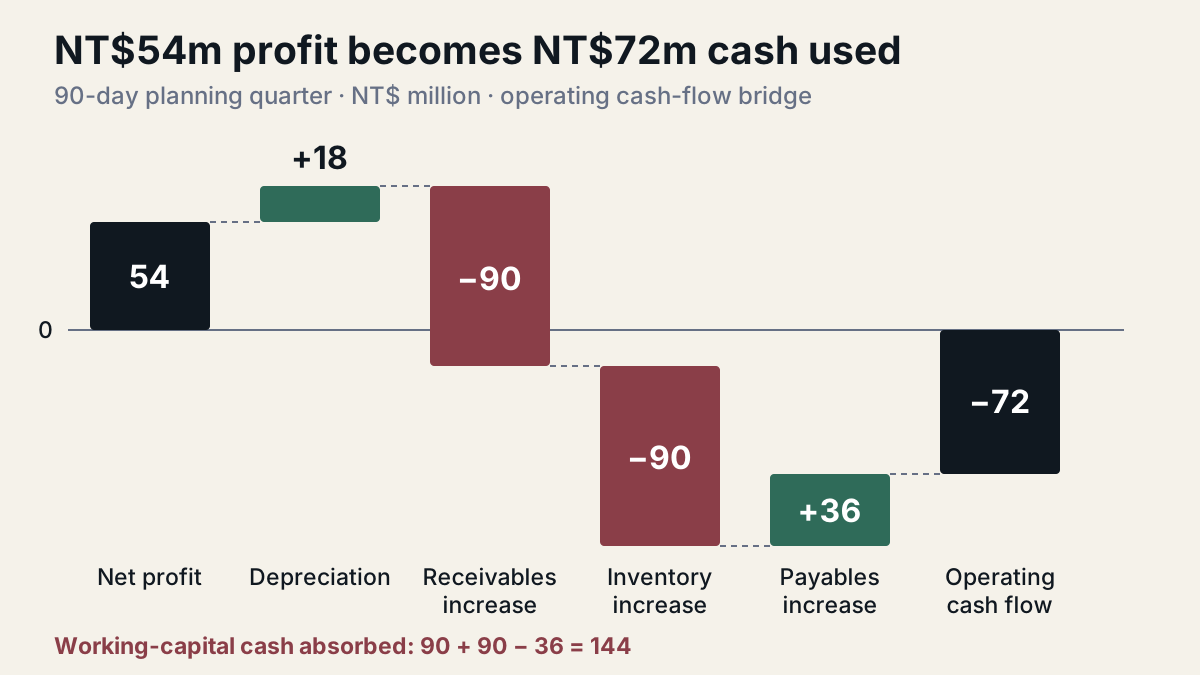
Here, operating working capital means receivables plus inventory minus trade payables. It rises from 156 to 300, consuming 144. The closing balance of 300 is the amount still tied up in operations; the increase of 144 is this quarter's cash absorption. Neither is the same as the 72 net operating cash outflow. Equipment purchases would enter investing cash flow separately.
Calculate days using matching averages and flows
The CFA Institute's ratio list combines inventory days and days sales outstanding, then subtracts payables days. It uses average operating balances and a purchases denominator for payables. For this exercise, average the opening and closing balances; monthly averages would describe a seasonal business more accurately.
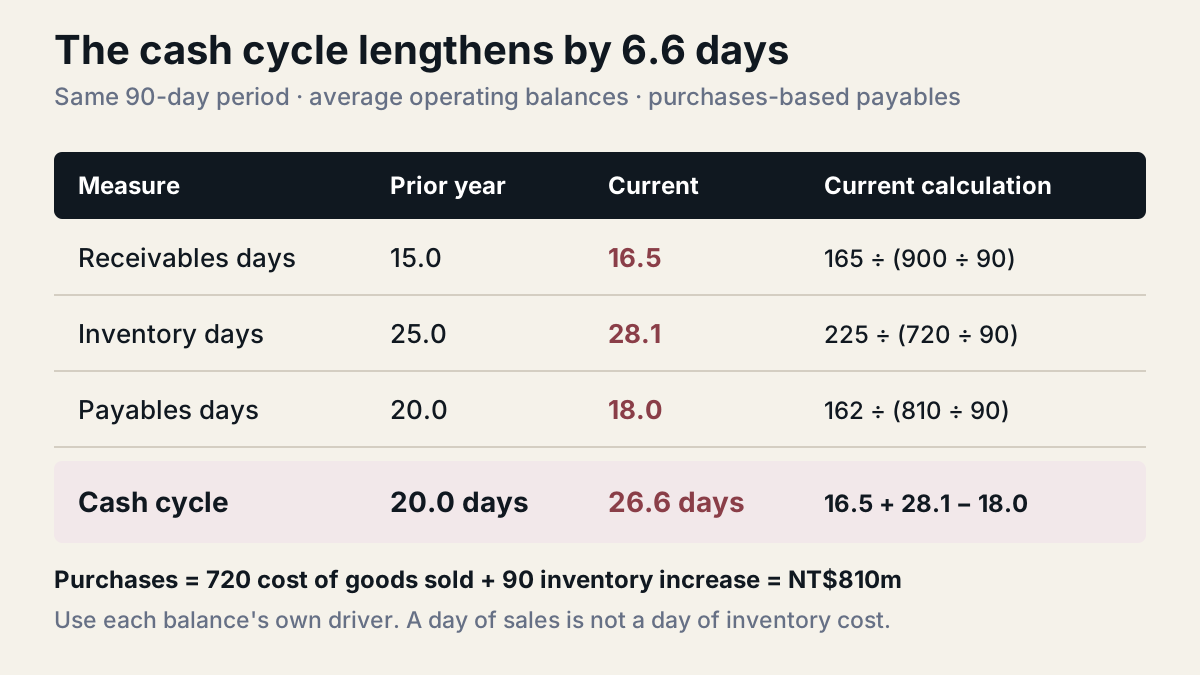
Average receivables are 165, inventory 225 and payables 162. Purchases equal cost of goods sold plus the inventory increase: 720 + 90 = 810. That identity works here because the supplier resells purchased modules without manufacturing conversion costs or other inventory adjustments.
| Measure | Calculation | Current quarter |
|---|---|---|
| Days sales outstanding: time represented by receivables | 165 ÷ (900 ÷ 90) | 16.5 days |
| Inventory days: time represented by stock | 225 ÷ (720 ÷ 90) | 28.1 days |
| Payables days: supplier payment timing | 162 ÷ (810 ÷ 90) | 18.0 days |
| Cash conversion cycle | 16.5 + 28.1 − 18.0 | 26.6 days |
Using cost of goods sold instead of purchases would overstate payables days here, because inventory is building. Also, dividing closing receivables of 210 by daily sales would produce 21 days, a different snapshot-based measure. It cannot silently replace the average-based 16.5 days.
Assume the comparable prior-year quarter had 15 receivables days, 25 inventory days and 20 payables days, calculated consistently. Its cycle was 20 days. The current cycle lengthens by approximately 6.6 days: receivables represent more sales days, inventory more cost days, and payables fewer purchasing days. These ratios flag timing changes to investigate; they do not prove contractual terms worsened.
Separate a seasonal peak from a lasting funding need
The longer cycle warrants investigation, but it does not establish customer distress. Delta Electronics' nine-month 2025 financial statements separately show receivables and inventory absorbing operating cash and payables providing an offset. Its credit-risk note groups receivables by overdue duration. That distinction matters: a larger receivables balance and a less collectible balance are different findings.
Test three explanations in the hypothetical supplier:
- More business: At unchanged operating days, additional sales still require more receivables and stock. Compare balances with activity before calling their growth inefficient. Funding for a permanently larger business will not fully disappear after one collection cycle.
- Launch timing: Match the extra modules to firm orders, delivery dates and acceptance conditions at the China and Vietnam plants. Compare the same seasonal point across years and inspect subsequent shipment and collection records. A planned stock build should have a credible route back to cash.
- Persistent deterioration: Check overdue invoices by customer, acceptance disputes, cancelled orders, slow-moving modules and changed supplier terms. Repeated delays after the launch weaken the seasonal explanation and may require a lower sales forecast or an inventory provision.
Do not promise a cash release by multiplying the entire cycle reduction by daily revenue. Receivables use sales, inventory uses cost, and payables use purchases. Each balance needs its own driver.
Give a conditional financing answer
A useful answer is: “Profit rose to 54, but operating working capital increased by 144, leaving 72 of operating cash used after adding back depreciation. The longer cash cycle adds concern beyond growth alone. I would test launch-linked stock and subsequent collections before deciding whether this is a temporary funding peak or a lasting requirement.”
Then specify the decision. Build a weekly forecast of customer receipts, supplier payments, taxes and capital expenditure. Test a delayed launch and a late major customer payment. A seasonal gap supported by firm orders and a reliable collection history could justify evaluating a revolving facility. Persistent stock and collection problems call for changed operating assumptions and funding that matches the longer requirement. The quarter's 72 outflow alone does not size a facility: existing cash, minimum liquidity and the lowest cash balance within the quarter matter.
Prepare for three follow-ups: Which invoices were collected after quarter-end? Which inventory is covered by cancellable orders? Would extending supplier terms risk delivery or discounts? Each answer should change a forecast input.
For your next exercise, rebuild the 54-to-minus-72 bridge without notes, then explain why the 300 closing working-capital balance is different. Record a 90-second answer and use the Investment Banking interview preparation page to continue practising the accounting and financing discussion.